Strategy Maps & Cause-and-Effect Alignment
Visual cause-and-effect modeling linking learning, process, customer, and financial objectives across the 4 Norton-Kaplan perspectives.
1. Overview & Business Value#
This comprehensive operational guide details the architecture, business workflows, configuration parameters, and execution steps for Strategy Maps & Cause-and-Effect Alignment within SmartERP.
Strategy Maps & Cause-and-Effect Alignment#
A strategy is not merely a collection of isolated goals; it is a hypothesis about cause and effect. In the Norton-Kaplan Balanced Scorecard methodology, performance flows from the foundation of Learning & Growth, driving Internal Business Processes, delivering superior Customer & Market Satisfaction, which ultimately achieves Financial Success.
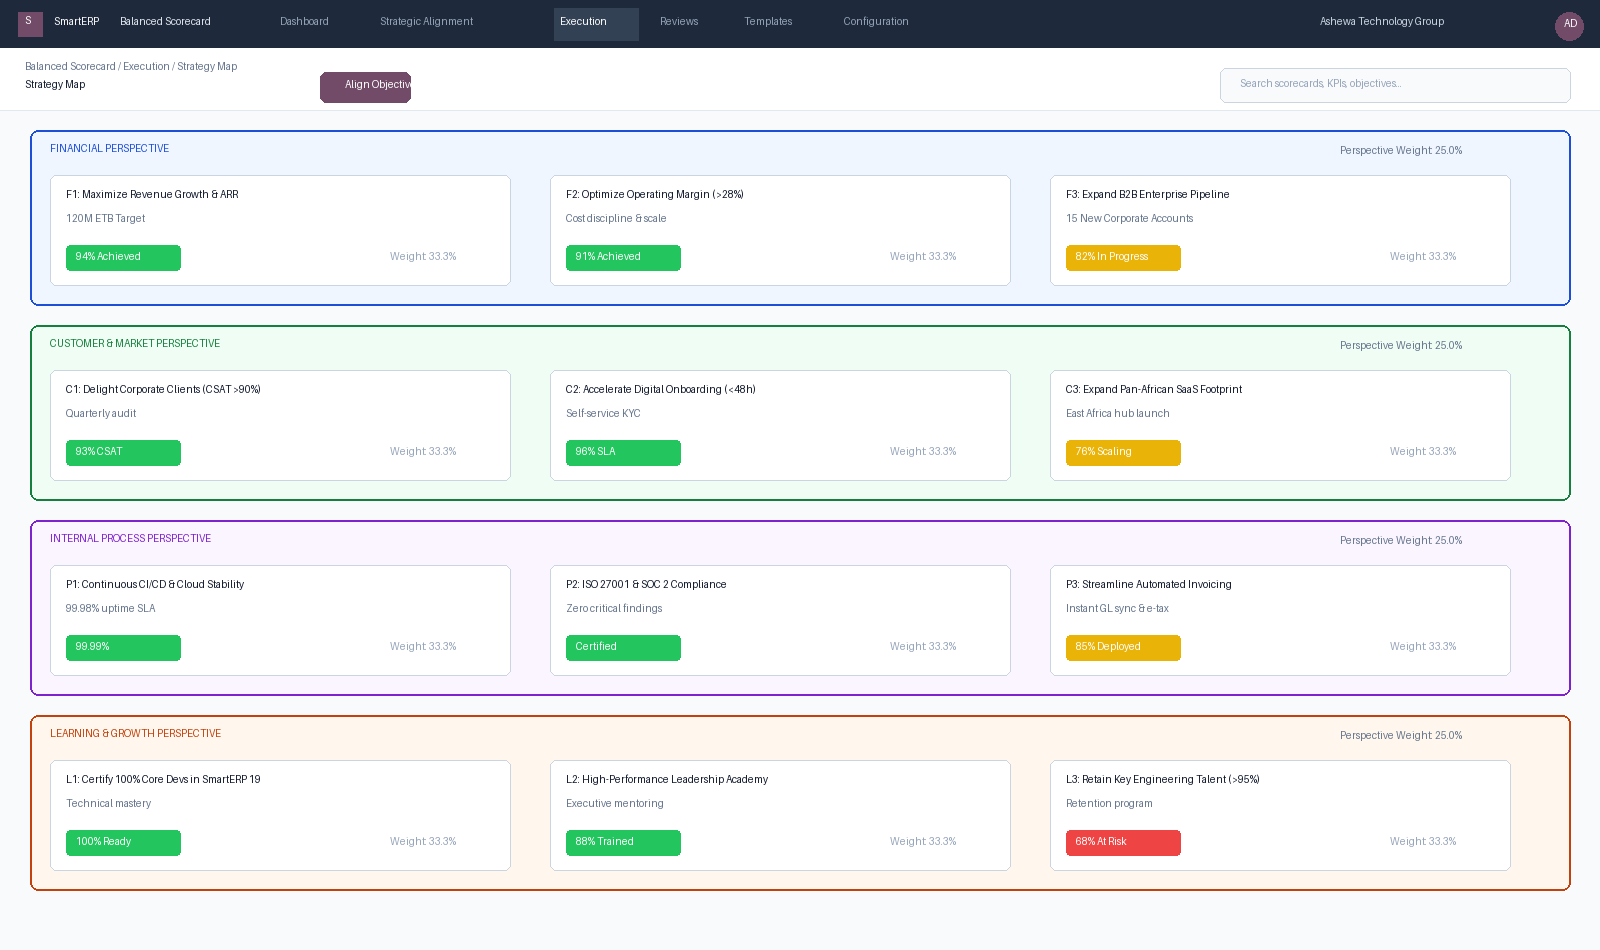
Figure 2.5: Interactive Strategy Map displaying balanced objectives, individual weights, cause-and-effect linkages, and live RAG status across all 4 perspectives.
{screenshot:strategy-maps-and-cause-effect-overview-dashboard}
2. Prerequisites & Security Access Groups#
- Required Modules:
smarterp_balanced_scorecard, smarterp_strategy - Security Groups:
Strategy Officer(Technical ID:smarterp_balanced_scorecard.group_bsc_user)Strategy Director(Technical ID:smarterp_balanced_scorecard.group_bsc_manager)Executive Committee Member(Technical ID:smarterp_balanced_scorecard.group_bsc_executive)
- Master Data Dependencies: Strategic themes, 4 BSC perspectives (Financial, Customer, Internal Process, Learning & Growth), corporate KPIs, and quarterly appraisal periods.
3. Step-by-Step Configuration & Execution#
Step 1: Navigating to the Module Interface#
- Log into your SmartERP instance at
https://smarterp.et/odoo. - Open the main App Switcher (grid icon in the top-left corner).
- Select the Strategic Execution app icon.
- From the top navigation bar, open Strategic Execution → Perspectives → Strategic Objectives / KPIs / Action Plans.
{screenshot:strategy-maps-and-cause-effect-app-switcher-navigation}
Step 2: Creating and Parameterizing Records#
- Click the New button in the top-left control panel.
- Complete the mandatory fields in the record form:
- Objective / KPI Name (Mandatory): Precise strategic outcome statement
- Perspective (Mandatory): One of the 4 balanced perspectives with mandated weighting
- Weight (%) (Mandatory): Percentage allocation contributing to overall perspective score
- Target Value & Baseline (Mandatory): Quantifiable numerical goal and historical starting point
- Configure optional operational parameters and localized tags as required:
- Calculation Formula (Optional): Automated SQL query or module model metric extraction
- Initiative Champion (Optional): Department head or senior manager accountable for result
- Review Frequency (Optional): Monthly, quarterly, or annual appraisal cadence
- Click the Save icon in the control bar to commit the record.
{screenshot:strategy-maps-and-cause-effect-record-creation-form}
Step 3: Validating and Processing Transactions#
- State Transitions: Execute operational state progression (Draft → Active Target → Mid-Term Review → Final Appraisal → Locked).
- Ledger & System Impact: Financial perspective KPIs dynamically read General Ledger balances, revenue growth metrics, and cost ratios directly from the accounting engine.
- Audit Verification: Automated recording of author ID, timestamp, and immutable revision history.
{screenshot:strategy-maps-and-cause-effect-transaction-processing-state}
1. The Four Standard Perspectives#
SmartERP 19 BSC organizes strategic execution into four core layers:
flowchart BT
    L["1. Learning & Growth\n(People, Culture, Skills, Technology)"] --> P["2. Internal Processes\n(Operational Excellence, Quality, CI/CD)"]
    P --> C["3. Customer & Market\n(CSAT, Retention, Brand Loyalty)"]
    C --> F["4. Financial\n(Revenue Growth, ARR, Margins, Cash Flow)"]
1.1 Financial Perspective (financial)#
Answers: To succeed financially, how should we appear to our shareholders and investors?
- Focus: Revenue expansion, operating margin %, return on capital, operating cash flow, and cost optimization.
- Target Weight: Typically 25% of the total scorecard index.
1.2 Customer & Market Perspective (customer)#
Answers: To achieve our financial vision, how should we appear to our customers?
- Focus: Customer Satisfaction Score (CSAT), Net Promoter Score (NPS), enterprise onboarding turnaround, customer retention %, and pan-African market share.
1.3 Internal Business Processes (process)#
Answers: To satisfy our customers and shareholders, in what business processes must we excel?
- Focus: Software delivery velocity, system uptime SLA (99.99%), ISO 27001 compliance, lead-to-cash cycle time, and automated invoice delivery.
1.4 Learning & Growth Perspective (learning)#
Answers: To achieve our vision, how will we sustain our ability to change, improve, and grow?
- Focus: Core engineering certifications in SmartERP 19, high-performance leadership training, key developer retention (>95%), and psychological safety index.
2. Configuring Cause-and-Effect Linkages (bsc.objective.link)#
To model direct causation between goals, planners connect objectives using Strategy Map Links:
- Navigate to Balanced Scorecard $\rightarrow$ Execution $\rightarrow$ Objectives.
- Open any active objective (e.g., F1: Maximize Revenue Growth & ARR).
- Under the Cause & Effect tab, specify:
- Driven By (Predecessor Objectives): Select upstream drivers (e.g., C1: Delight Corporate Clients and C3: Expand Pan-African Footprint).
- Drives (Successor Objectives): Downstream objectives that this goal directly empowers.
- Strength of Influence:
Strong,Moderate, orEmerging.
When viewed in the Strategy Map view (Balanced Scorecard $\rightarrow$ Execution $\rightarrow$ Strategy Map), objectives render dynamically with live RAG status rings and connector arrows showing strategic causality.
4. Advanced Configuration Points#
- Automated Actions & Scheduled Tasks (Crons):
BSC: Calculate quarterly KPI achievements(smarterp_bsc.ir_cron_compute_kpi): Runs quarterly on the 5th to compute composite achievement scoresBSC: Issue appraisal cascade reminders(smarterp_bsc.ir_cron_appraisal_alert): Runs monthly to remind objective champions to update progress
- Custom Print Templates & Reports:
- Institutional Balanced Scorecard Executive Dashboard
- Departmental Strategic Cascade Matrix
- KPI Performance Variance & Trend Analysis
- Corporate Strategy Execution Summary
- Multi-Company Rules: Record-level security isolation under Company 1 (
Ashewa Technology Solutions S.C.), preventing cross-company ledger leakage across parent and subsidiary legal entities.
5. Comprehensive Troubleshooting Matrix#
| Error Symptom / Exception | Probable Root Cause | Corrective Action / Resolution |
|---|---|---|
Weighting Error: Perspective weights do not equal 100% | Total weights assigned to objectives within perspective fail to sum to 100.00%. | Adjust individual objective weightings so the perspective total equals exactly 100%. |
Data Feed Error: Automated KPI metric returned null | Underlying model query failed or target database view has no records. | Verify connected model name and filter domain in the KPI automated calculation parameters. |
Lockout Error: Period results locked for executive review | Current appraisal quarter has been locked by the Strategy Director. | Obtain written authorization and request temporary unlock from the Strategy Director. |