Financial dashboards and reporting
Real-time Trial Balance, multi-department P&L, Balance Sheet, project commercial profitability, executive KPI drill-downs, and IFRS financial statements.
SmartERP Financial Reporting and Intelligence provides real-time statutory financial statements, multi-dimensional analytical reporting, project profitability drill-downs, and an executive KPI catalog.
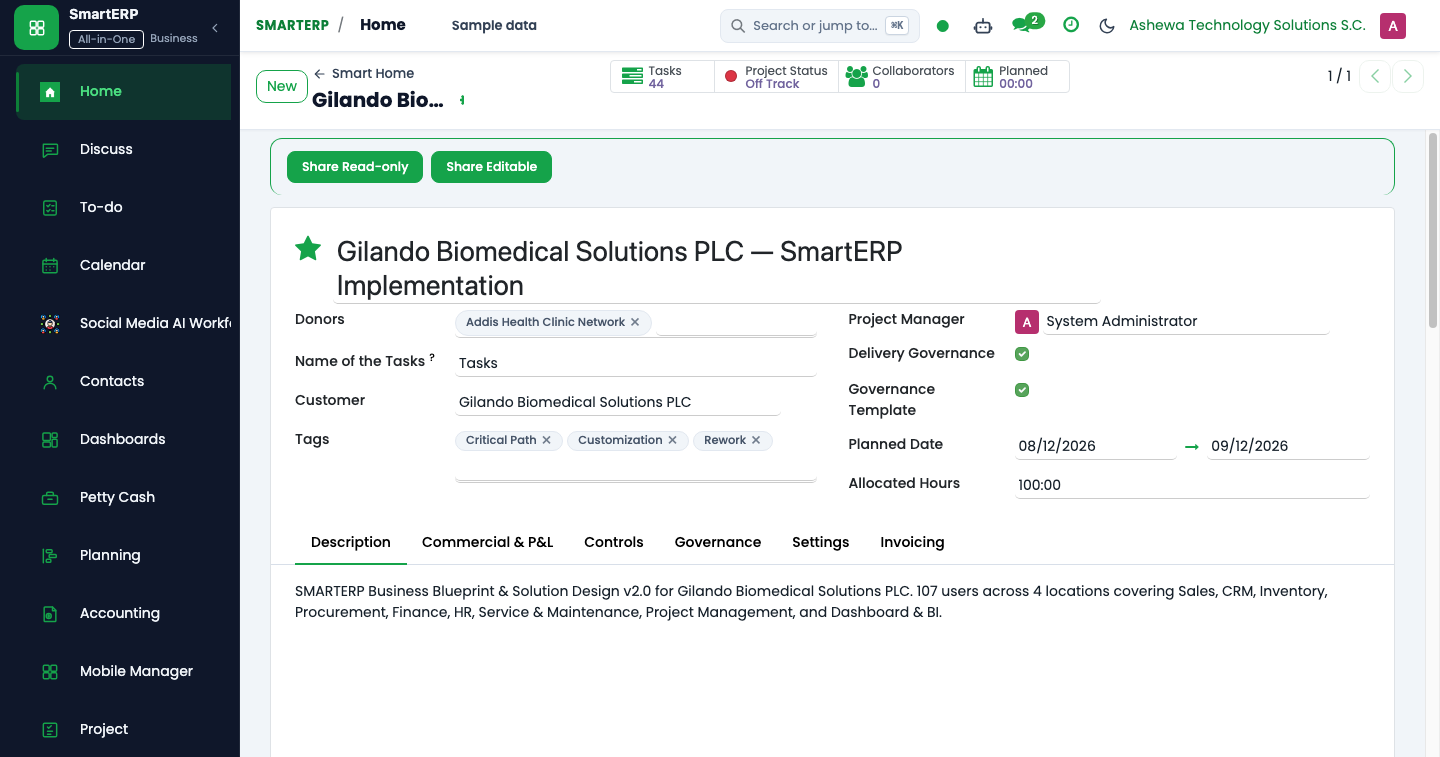
Real-Time Reporting Engine Architecture#
Unlike legacy ERP systems that rely on slow, overnight batch rollups, SmartERP computes all financial reports directly from posted journal items (account.move.line) in real time:
- Zero Latency: As soon as an accountant posts a voucher or bill, the Trial Balance, Balance Sheet, and P&L update instantaneously.
- Full Traceability: Every number on an executive report supports multi-level drill-down—from the high-level summary down to the individual journal entry, partner record, and scanned tax attachment.
- Dual Calendar Filtering: Reports can be rendered by Gregorian fiscal quarters or Ethiopian statutory months (Meskerem through Pagume).
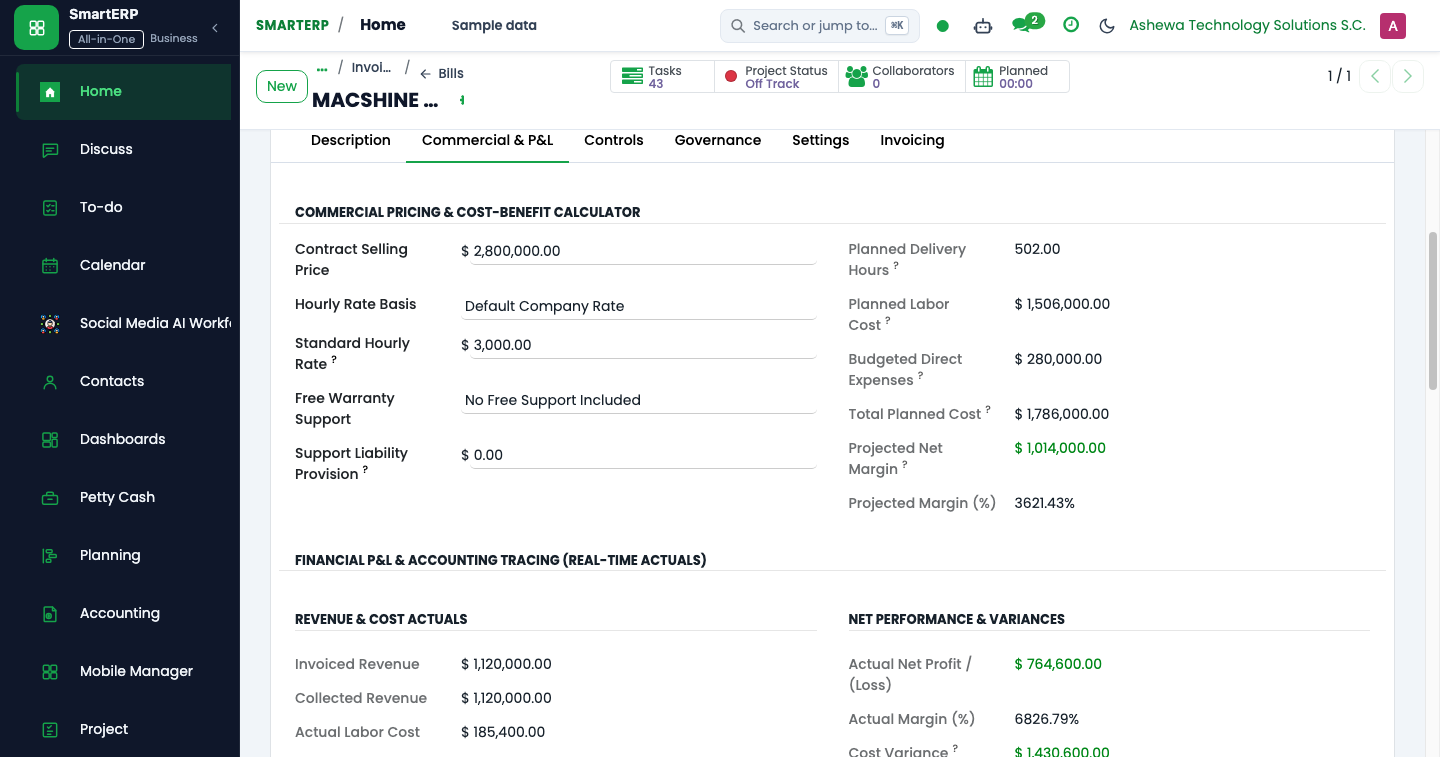
Core Statutory Financial Statements#
1. Real-Time Trial Balance (18_trial_balance.png)#
Provides a comprehensive overview of all accounts in the Chart of Accounts:
- Initial Balance: Carried forward from previous fiscal periods.
- Period Movements: Debit and Credit transactions within the selected date window.
- Ending Balance: Real-time net position.
- Strictly validates that $\sum ext{Debits} = \sum ext{Credits}$ across the enterprise.
2. Balance Sheet (Statement of Financial Position)#
Structured according to IFRS standards:
- Assets: Current Assets (Cash, Bank, Accounts Receivable, Inventory, WHT Receivable) and Non-Current Assets (Property, Plant & Equipment, Accumulated Depreciation).
- Liabilities: Current Liabilities (Accounts Payable, WHT Payable, VAT Payable, Accrued Payroll) and Long-Term Liabilities (Bank Term Loans).
- Equity: Share Capital, Statutory Reserves, and Retained Earnings (including automated current-year unclosed P&L result).
3. Profit & Loss Statement (Income Statement)#
Multi-step operating breakdown:
- Operating Revenue: Gross sales less returns and trade discounts.
- Cost of Goods Sold (COGS): Direct materials, subcontractor expenses, and absorbed labor.
- Gross Profit & Gross Margin %
- Operating Expenses (OPEX): Selling, General, and Administrative (SG&A) expenses, utilities, depreciation, and payroll.
- Operating Profit (EBITDA & EBIT)
- Net Profit After Tax
4. Cash Flow Statement#
Tracks liquid cash movements using both Direct and Indirect methods:
- Operating Activities: Customer cash receipts less supplier disbursements, employee payroll, and tax remittances.
- Investing Activities: Capital expenditure (Capex) on equipment and technological assets.
- Financing Activities: Shareholder capital injections, dividend disbursements, and debt service.
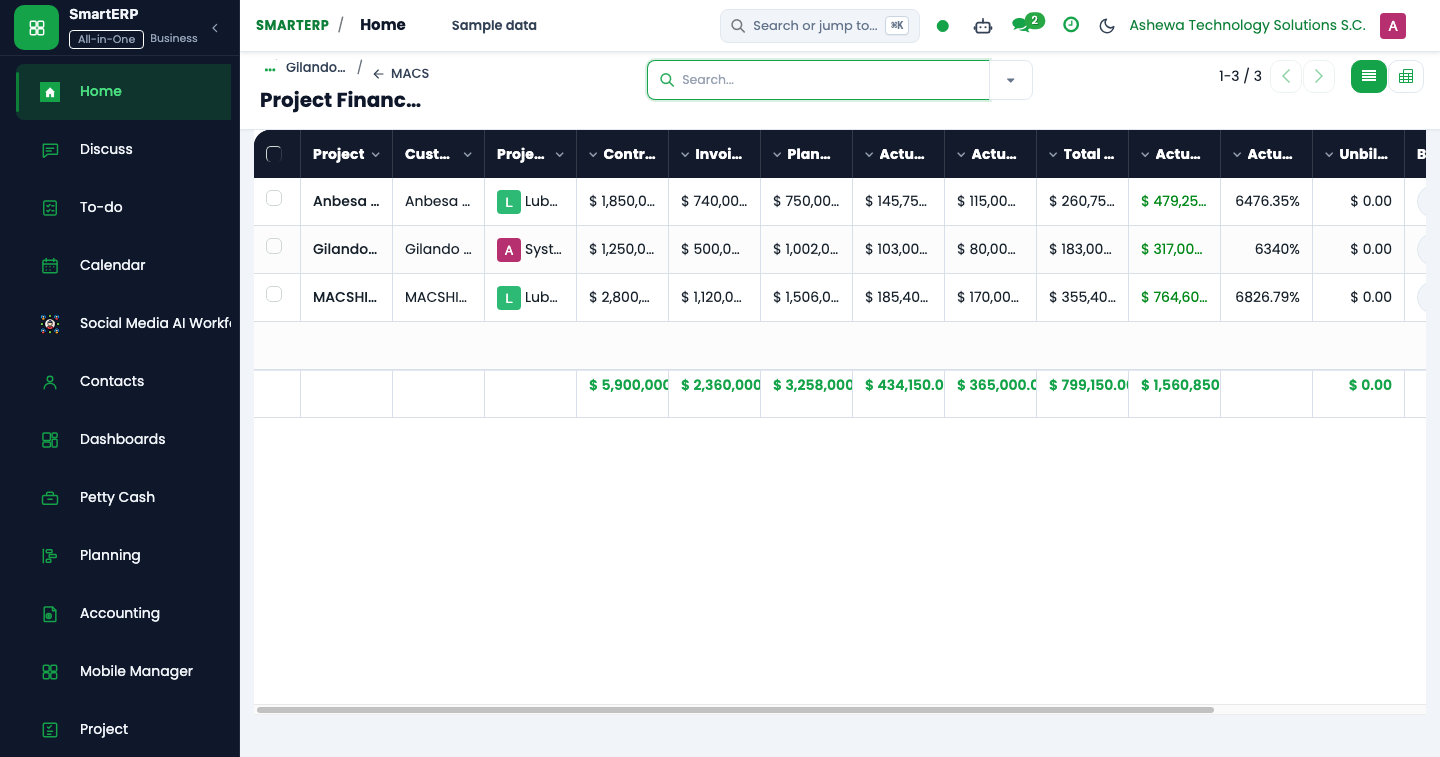
Multi-Dimensional Analytical and Project P&L#
SmartERP integrates general ledger accounts with analytic distribution models to deliver deep operational intelligence:
- Departmental Cost Center Accounting: Track expenditure across Sales, Marketing, IT Operations, Human Resources, and Administration.
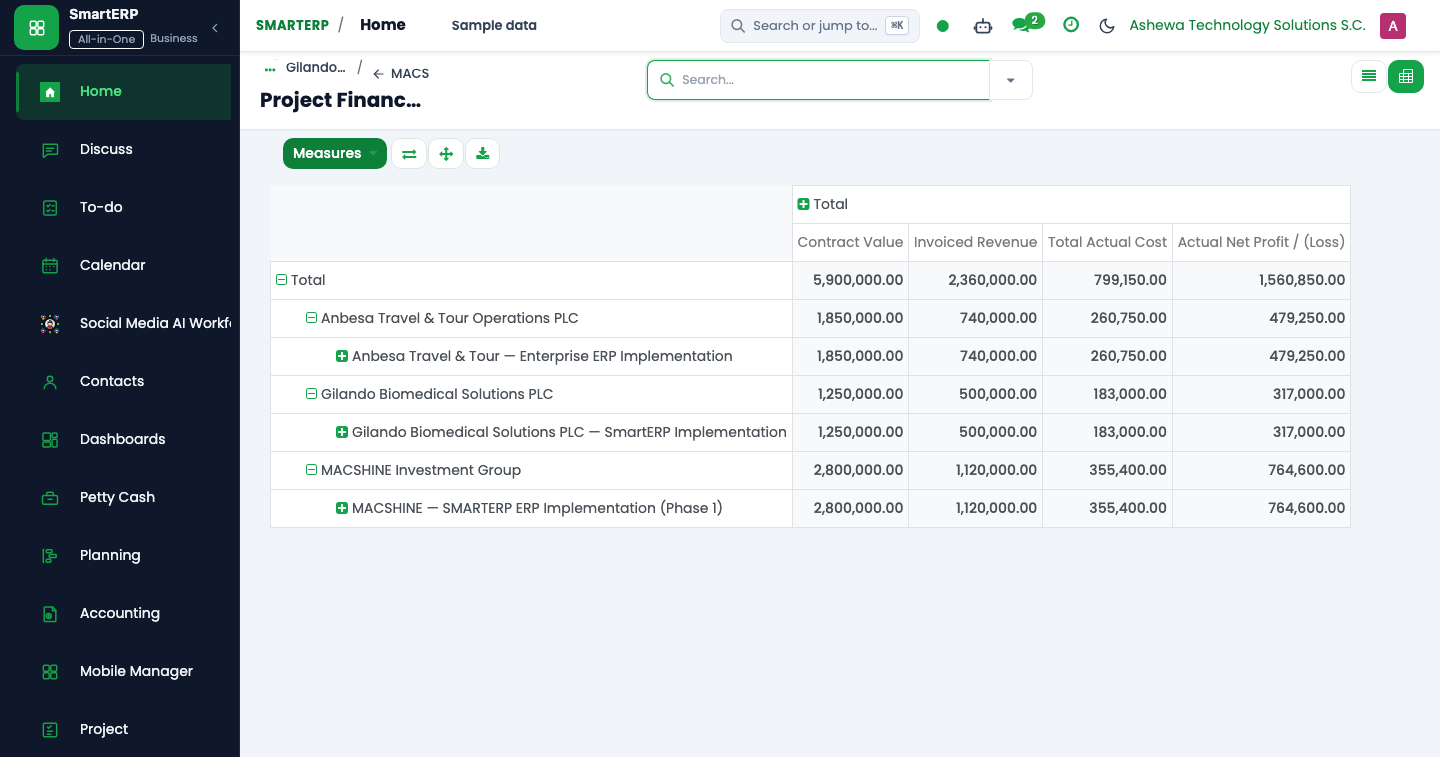
- Project Commercial Profitability (
smarterp_project_dashboard):- Revenue: Contract milestone billings.
- Timesheet Cost Absorption: Real-time labor costs computed by multiplying logged employee timesheet hours by the employee's contract hourly cost rate (
smart_enterprise_timesheet). - Direct Materials & Subcontractor Bills: Directly tagged to the project's analytic account.
- Commercial Variance: Continuous tracking of Actual Costs vs. Planned Baseline Budgets.
Executive Financial Intelligence KPI Catalog (smarterp_accounting_dashboard)#
The accounting.dashboard singleton engine exposes ~95 verified financial metrics categorized into 9 operational groups:
+----------------------------------------------------------------------------------------------------+
|                               SMARTERP EXECUTIVE FINANCIAL KPI ENGINE                              |
+------------------------------------+---------------------------------------------------------------+
| KPI Group                          | Key Metrics & Computational Logic                             |
+------------------------------------+---------------------------------------------------------------+
| **1. Revenue**                     | • Total Revenue (FY-to-date posted income)                    |
|                                    | • Revenue Growth % (vs. prior fiscal year)                    |
|                                    | • Active Invoiced Customers & Average Invoice Value           |
|                                    | • Customer Concentration (Share of Top Customer)              |
+------------------------------------+---------------------------------------------------------------+
| **2. Profitability**               | • Gross Profit & Gross Margin % (Revenue vs. COGS)            |
|                                    | • EBITDA & Net Profit Margin %                                |
|                                    | • Operating Expense Ratio (OPEX / Revenue)                    |
+------------------------------------+---------------------------------------------------------------+
| **3. Expenses**                    | • Total Operating Expenses (SG&A)                             |
|                                    | • Direct Project Cost Lines & Labor Absorption                |
|                                    | • Depreciation & Amortization Burn                            |
+------------------------------------+---------------------------------------------------------------+
| **4. Cash & Liquidity**            | • Total Liquid Cash & Bank Position                           |
|                                    | • Current Ratio (Current Assets / Current Liabilities)        |
|                                    | • Quick Acid-Test Ratio (Liquid Cash + AR / Current Liab.)    |
|                                    | • Cash Runway (Days of Operating Cash remaining)              |
+------------------------------------+---------------------------------------------------------------+
| **5. Receivables (AR)**            | • Total Outstanding Customer Receivables                      |
|                                    | • Days Sales Outstanding (DSO)                                |
|                                    | • Aging Buckets: Current, 1-30, 31-60, 61-90, 90+ Days        |
+------------------------------------+---------------------------------------------------------------+
| **6. Payables (AP)**               | • Total Outstanding Vendor Payables                           |
|                                    | • Days Payable Outstanding (DPO)                              |
|                                    | • Vendor Concentration (Largest Single Supplier Share %)      |
|                                    | • Aging Buckets: Current, 1-30, 31-60, 61-90, 90+ Days        |
+------------------------------------+---------------------------------------------------------------+
| **7. Budget & Planning**           | • Corporate Budget Variance %                                 |
|                                    | • Committed vs. Invoiced Burn Rate                            |
|                                    | • Departmental Budget Utilization %                           |
+------------------------------------+---------------------------------------------------------------+
| **8. Financial Position**          | • Total Net Assets & Working Capital                          |
|                                    | • Debt-to-Equity Ratio                                        |
|                                    | • Return on Capital Employed (ROCE)                           |
+------------------------------------+---------------------------------------------------------------+
| **9. Accounting Controls**         | • Net Tax Position (Output VAT minus Recoverable Input VAT)   |
|                                    | • Withholding Tax Liability Exposure                          |
|                                    | • Unreconciled Bank Lines Count & Aging                       |
|                                    | • Pending Maker-Checker Approvals Count                       |
+------------------------------------+---------------------------------------------------------------+
The "Not Configured" Safety Guarantee#
SmartERP enforces strict reporting integrity. If an underlying capability has not yet been implemented (for example, no corporate budget configured, or no analytic accounts assigned), the dashboard reports "Not configured" rather than displaying a misleading zero or simulated number.