Project and governance dashboard
Navigating the unified SmartERP Project Dashboard for executive oversight, active sprint burndowns, commercial margin analysis, and portfolio health monitoring.
The SmartERP Project Dashboard (smarterp_project_dashboard) aggregates data from projects, tasks, sprints, budgets, and timesheets into a single executive command center. It eliminates manual spreadsheet reporting by computing real-time indicators directly from operational database records.
[projects-data-model]
Core dashboard metrics#
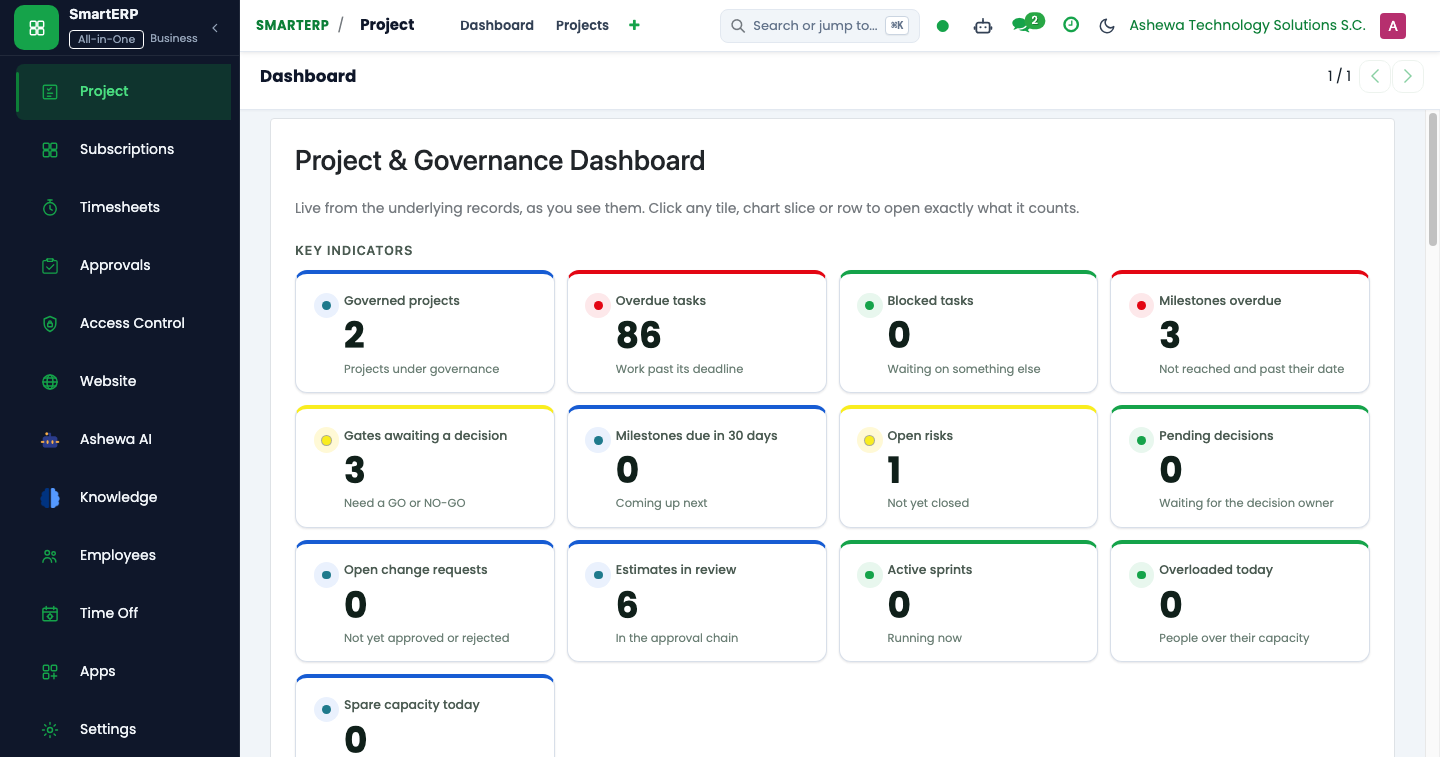
The dashboard interface presents four primary executive KPI domains:
- Portfolio Health & Governance:
- Active Governed Projects: Total projects currently progressing through Gates 0 to 4.
- Gate Progression Status: Count of projects at each stage gate.
- High-Risk Items: Open risks in the RAID register with risk exposure score exceeding critical thresholds.
- Sprint & Agile Execution:
- Active Sprints: Total agile sprints currently running across engineering teams.
- Average Velocity: Story points delivered across completed sprints over the trailing 90 days.
- Open Blockers: Count of tasks marked
blocked, grouped by SLA urgency.
- Commercial Margins & Budget Variance:
- Total Budget Baseline vs EAC: Cumulative planned budgets against current Estimate at Completion forecasts.
- Projects in Warning / Critical: Count of projects exceeding cost baseline tolerance.
- Normalized Commercial Margin: Net profitability after labor recovery and vendor costs.
- Capacity & Resource Utilization:
- Logged vs Planned Hours: Timesheet compliance percentage for the current week.
- Resource Outlook: SQL-view projection (
project.resource.outlook) linking future planned task hours against available team capacity.
Interactive charts and drill-down#
Built with modern Owl components (project_dashboard_charts.esm.js), the dashboard enables instant drill-downs:
- Clicking on a Gate Status bar filters the project list to projects awaiting sign-off at that specific gate.
- Clicking on the Budget Overrun card navigates directly to the variance ledger of affected projects.
- Clicking on an Active Sprint card opens the live Kanban board for that sprint.
Tip
The dashboard data is calculated using a single-record cache (project.dashboard) that refreshes automatically when underlying project or task states change, guaranteeing zero performance impact during peak hours.